-Introduction:
Candlestick analysis techniques are one of the main tools in the world of forex trading. This type of analysis provides a unique and comprehensive view of price movements, as it involves reading and analyzing candlestick charts. In this article, we will take a look at the importance of candlestick analysis techniques and how they can be used to make informed trading decisions
-To make informed decisions based on candlestick analysis, you should follow some basic steps:
- Choose the timeframe you want to analyze, such as hourly, daily, or weekly.
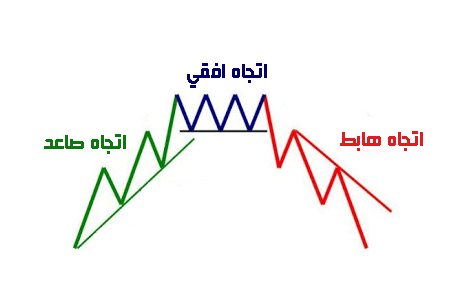
- Look at the overall price trend—Is it upward, downward, or sideways?
- Identify key support and resistance levels, which are points that the price has difficulty breaking through or reversing from.
- Look for candlestick patterns that confirm the price direction or predict a change, and ensure they align with other technical indicators.
- Set your target and stop-loss based on your risk and desired reward.
- Stick to your trading plan and avoid getting carried away by emotions
-Basics of Candlestick Analysis:
Candlestick and Its Formation: Each candlestick on the chart represents a specific time period and shows the opening price, closing price, highest price, and lowest price. Candlesticks form patterns that reflect the relationship between supply and demand and the prevailing forces in the market.
Candlestick Patterns: There are many candlestick patterns such as the hammer, reversal patterns, and continuation patterns. Understanding these patterns helps traders identify potential market trends
-Trend Analysis Using Candlesticks:
- Uptrend: Candlesticks with long white or green bodies appearing at the bottom indicate the strength of the upward trend.
- Downtrend: Candlesticks with long red or black bodies appearing at the top indicate the strength of the downward trend
-How to Use Candlestick Analysis Techniques:
Confirming Trends: Candlestick analysis is used to confirm expected trends. For example, a bullish candlestick pattern indicates a potential price increase, while a bearish candlestick pattern suggests a possible price decline.
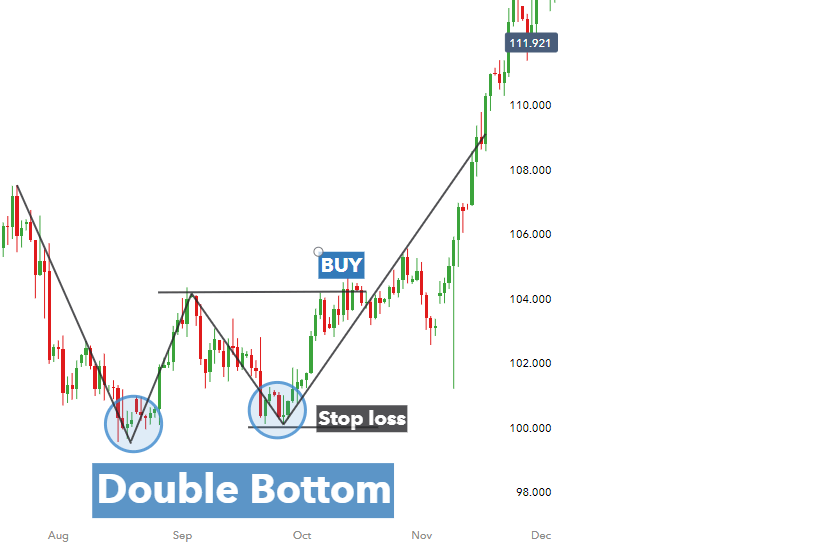
Identifying Entry and Exit Points: By using candlestick patterns, traders can determine the best times to enter and exit the market. For instance, the formation of a hammer candlestick may indicate a potential trend reversal
-The Importance of Reading Patterns:
Understanding Market Behavior: Reading candlestick patterns enables traders to understand market behavior and determine when buying or selling forces take control.
Analyzing Supply and Demand: Candlesticks provide information about the balance between supply and demand, with certain patterns indicating a shift in this balance
-Bullish Candlestick Patterns:
Bullish candlestick patterns indicate the approach of an upward market trend, allowing traders to determine their next moves. These patterns appear after a series of downward price movements. An asset is considered to be in a bullish market if it recovers by 20% or more from its market low.
Bullish markets are characterized by increased investor confidence, reflecting how bulls thrust their horns upward when attacking their prey. This movement is used metaphorically to indicate rising asset prices, as if the bull is pushing prices higher. A bullish market can last for months or even years
-Identifying Patterns:
Beginners can practice identifying these patterns by opening a trading dashboard for any cryptocurrency exchange and observing past price patterns. However, traders cannot rely solely on candlestick patterns for decision-making. They should also use support and resistance levels, market sentiment, and trend lines to determine price movements.
Bullish candlestick patterns can indicate either a reversal or a continuation of an asset’s price trend. A bullish reversal suggests that the downward trend will soon reverse into an upward trend. On the other hand, a bullish continuation pattern means that the uptrend will continue after a brief pause and breakout.
-Bullish Candlestick:
A bullish candlestick is a candle that indicates an upward price trend within a specific time frame. It shows an increase in the value of a commodity, stock, forex pair, or cryptocurrency. This candlestick signals a price rise during the designated period.
A green candlestick represents bullish movement, but a white candlestick is also commonly used. A candlestick chart is formed by multiple candles, displaying an asset's price movements over time using candlestick patterns.
-Bearish Candlestick:
A bearish candlestick forms when the price opens at a certain level and closes at a lower level, representing a price decline. Typically, a bearish Japanese candlestick is red, but black is also widely used.
The bearish engulfing pattern is a technical chart pattern that signals an imminent price drop. It consists of a long red body followed by three small green bodies and another red body, forming the bearish pattern. All green candles are contained within the range of the bearish bodies. This pattern indicates to traders that buyers (bulls) lack the strength needed to reverse the trend
-Conclusion:
In the world of currency trading, candlestick analysis is a powerful strategy for traders seeking to make informed decisions. By carefully reading and correctly utilizing candlestick patterns, traders can enhance their market understanding and increase their chances of success in the volatile trading environment